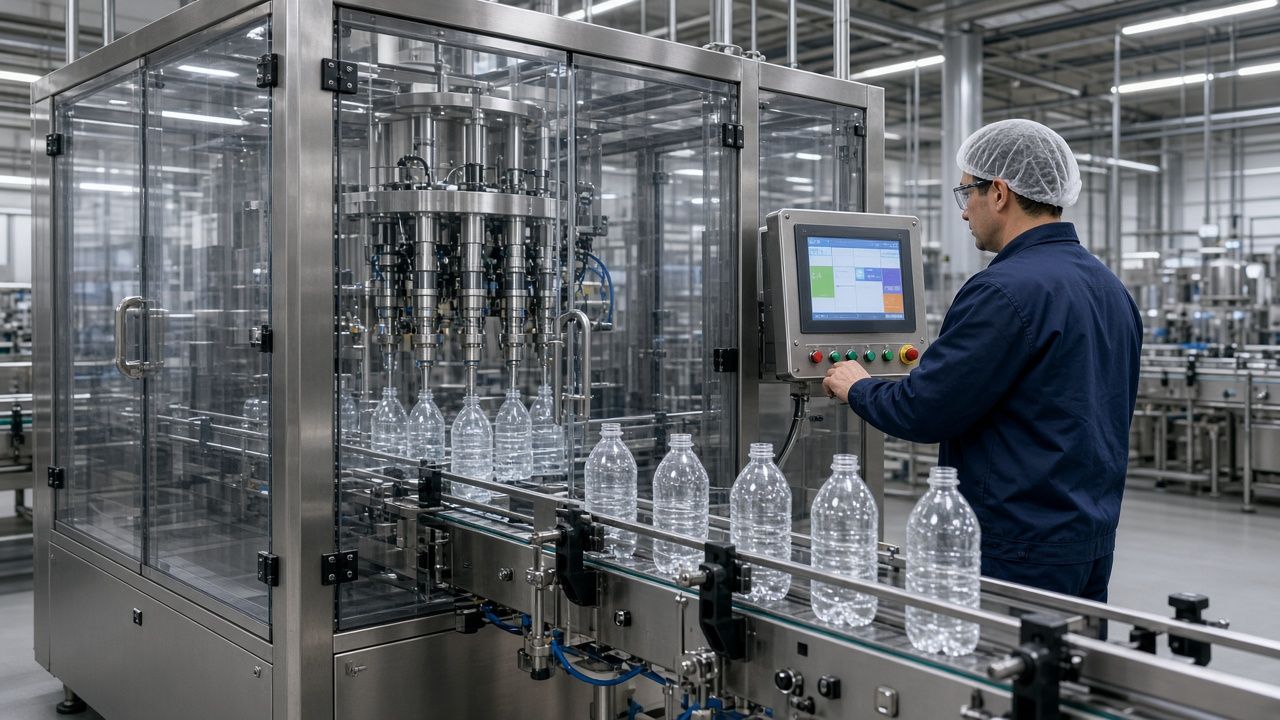
What Is Gross / Nameplate / Rated Capacity
Gross, nameplate, or rated capacity is the throughput a line is designed to achieve under ideal, continuous running conditions — no stops, no product change, perfect feed, and no rejects. It is a specification, not a production result.
It is usually expressed in bottles per hour (BPH) for a stated container and product. If you need a refresher on the unit itself, see What Is BPH in Bottling?
What Is Net / Actual Production Capacity
Net or actual production capacity is the volume of good, sellable bottles delivered over a defined period (a shift, a day, a week) after all stops and losses are subtracted.
Net capacity is the number your sales, logistics and finance teams actually care about. It decides whether you can fill orders, and it is the basis for any honest payback calculation.
Why They Differ
A line is rarely available for productive running 100% of the time, and not every bottle produced is shippable. The gap between gross and net is created by planned and unplanned losses.
A simple way to see the gap is to account for every hour in the period:
- Calendar time — all hours in the period.
- Planned production time — calendar time minus hours you do not intend to run (no shift, holidays).
- Run time — planned time minus changeovers, CIP, maintenance and breakdowns.
- Good output — what the line made during run time, minus speed losses and rejects.
The core relationship is: Net output = Gross rated BPH × Planned hours × Availability × Performance × Quality.
Common Factors That Reduce Net Output
Changeover
Switching formats or products stops the line. Change parts, guide rails, filling-valve settings and labeller adjustments all take time, plus a ramp-up period before the line is back to speed. Frequent short runs magnify this loss.
CIP (Clean-in-Place)
Scheduled cleaning consumes production time. Its frequency depends on product: a juice or dairy line usually needs more cleaning than a still-water line, and a flavour change may require an extra rinse.
Planned Maintenance
Preventive maintenance removes hours from the schedule. Skipping it does not create capacity; it simply converts planned stops into longer unplanned ones.
Unplanned Downtime
Breakdowns and faults reduce availability. Jams at transfer star-wheels, preform supply interruptions and waiting for packaging materials are common causes.
Bottle Rejection
Quality losses (fill faults, cap defects, contamination) reduce the sellable count. Start-up bottles after a stop are often rejected too.
Product Characteristics
Carbonation, viscosity, and temperature change fill speed. Carbonated products need counter-pressure filling and settling time, and warm product foams more easily.
Operator Intervention
Manual adjustments and slow restarts reduce performance. Training and clear standard procedures are among the cheapest ways to recover capacity.
Downstream Packaging Limits
Labeling, packing, or palletizing slower than the filler bottleneck the whole line. Good line design gives downstream machines extra speed and enough accumulation to absorb short stops.
We do not publish a fixed "typical" percentage loss, because the gap depends entirely on your product, schedule, and equipment.
Worked Example: From Gross to Net
Illustrative example only — the figures below are assumptions chosen to show the method, not typical or guaranteed values for any line.
- Rated capacity: 10,000 BPH on 500 ml still water.
- Planned production time: 2 shifts × 8 h = 16 h per day.
- Changeover: 1 per day at 45 min; CIP: 60 min per day; unplanned stops: 45 min per day. Total lost: 2.5 h.
- Run time = 16 − 2.5 = 13.5 h → Availability = 13.5 ÷ 16 ≈ 84%.
- Bottles produced during run time: 121,500 → actual rate 9,000 BPH → Performance = 9,000 ÷ 10,000 = 90%.
- Rejects: 2,430 → good bottles 119,070 → Quality = 98%.
- OEE ≈ 0.84 × 0.90 × 0.98 ≈ 74%; net output ≈ 119,000 good bottles per day.
The naive figure, 10,000 × 16 = 160,000, overstates real output by more than a third. Repeat the same arithmetic with your own schedule and loss estimates before you commit to a line size.
Sizing a Line from Net Demand
Work backwards from what you must ship: Required gross BPH = Required good bottles per day ÷ (Planned hours × expected OEE). Illustrative example: 100,000 good bottles over 16 hours at an assumed 70% OEE needs about 100,000 ÷ 11.2 ≈ 8,930 BPH rated — so a line in the 10,000 BPH class, not an 8,000 BPH one.
How to Read a Supplier Quote
A quote that states only "rated capacity" tells you the design ceiling, not what you will ship. Compare quotes on the same basis, and ask what assumptions sit behind the number.
Check which machine the figure refers to. A filler rated at 12,000 BPH paired with a labeller rated at 10,000 BPH is a 10,000 BPH line at best. Check, too, that the figure applies to your bottle size and product, not the supplier's most favourable format.
Common Buyer Mistakes
- Treating rated capacity as output. Budgets and sales plans built on nameplate figures will miss.
- Comparing gross from one supplier with net from another. Normalise every quote to the same basis first.
- Forgetting changeover frequency. A multi-SKU plant may lose far more time to changeovers than a single-format plant.
- Ignoring CIP and maintenance in the schedule. These are planned, predictable losses and belong in the plan.
- Over-trusting a single OEE number. OEE is a framework; your own measured data is what counts.
What to Require in Your RFQ
Ask each supplier to state, in writing:
- rated or nameplate capacity;
- expected net output for your product and schedule;
- operating schedule (shifts, hours per day);
- changeover time between your formats;
- CIP time and frequency;
- assumptions (bottle size, product, reject rate);
- bottleneck equipment in the line.
Also ask how speed and efficiency will be tested at factory acceptance and site acceptance, and for how long. iBottling has built bottling equipment since 1995, from an ISO 9001-certified factory supplying CE-marked machines to more than 150 export countries; we encourage buyers to make these assumptions part of the contract.
Tracking Net Capacity After Installation
Gross versus net is not only a purchasing question. Once the line is running, record every stop with its duration and cause, count bottles produced and bottles rejected per shift, and calculate availability, performance and quality separately. A single OEE figure tells you that capacity is being lost; the three factors tell you where. In my experience the largest gains usually come from the losses nobody was measuring — short jams under two minutes, slow restarts after breaks, and changeovers that run long because parts or settings were not prepared in advance. Review the data weekly with operators and maintenance, fix the biggest loss first, then re-measure. Over time, this measured baseline also gives you far better inputs for sizing your next line.
BPH, OEE and Net Output
BPH is the hourly rate; net output is the realized volume; OEE (Overall Equipment Effectiveness) explains the capture rate between them through Availability × Performance × Quality. OEE is a framework, not a substitute for measuring your own line. See What Is BPH in Bottling? for the definition.
Frequently Asked Questions
Is net capacity ever equal to gross capacity?
Not in practice over a full day. Any changeover, cleaning, stop or reject makes net output lower than gross.
Can a supplier guarantee net output?
Net output depends heavily on your operation — staffing, materials, maintenance and SKU mix. A supplier can commit to machine speed and efficiency under defined test conditions; agree those conditions in writing.
How do I raise net output without buying a bigger line?
Reduce changeover time, plan longer runs, optimise CIP cycles, train operators and remove downstream bottlenecks. Measuring losses is the first step.
Should CIP be included in OEE?
Plants differ. Some exclude planned cleaning from planned production time; others count it as an availability loss. Pick one definition and use it consistently.
How much headroom should I build in?
That depends on growth plans and risk tolerance. Base it on your forecast and realistic OEE rather than a rule of thumb.
Related Resources
- BPH / line cost calculator
- OEE guide
- Equipment list
- Water bottling solutions
- 5-gallon cost reference
Next: Request a Quote
Write your RFQ with the capacity basis explicit, then contact us: Request a Quote.